ArcGIS Enterprise Performance Troubleshooting: From Symptoms to Root Cause

1.0 Introduction
Performance issues are among the most challenging problems ArcGIS Enterprise administrators face. Unlike a service outage, where the failure is obvious, performance degradation often develops gradually and can stem from multiple layers of the system simultaneously.
Users typically report symptoms such as:
- Web maps taking an unusually long time to load.
- Feature services responding slowly during editing operations.
- Geoprocessing services timing out intermittently.
- ArcGIS Server services crashing or restarting unexpectedly.
- Portal pages loading slower than expected.
The challenge is that these symptoms rarely point directly to the underlying cause. A slow map may be caused by overloaded ArcSOC processes, insufficient memory, database latency, network bottlenecks, poorly configured service pools, or even an undersized Java heap.
This guide aims to provide a systematic approach for investigating ArcGIS Enterprise performance issues. Rather than focusing on isolated settings or one-off fixes, we will build a troubleshooting framework that helps administrators identify bottlenecks, interpret system metrics, and make informed tuning decisions.
By the end of this guide, you should be able to answer three critical questions:
- What component is actually slow?
- Why is it slow?
- What configuration changes will improve performance without creating new bottlenecks?
2.0 Understanding ArcGIS Enterprise Architecture
Before troubleshooting performance issues, it is important to understand how requests travel through ArcGIS Enterprise.
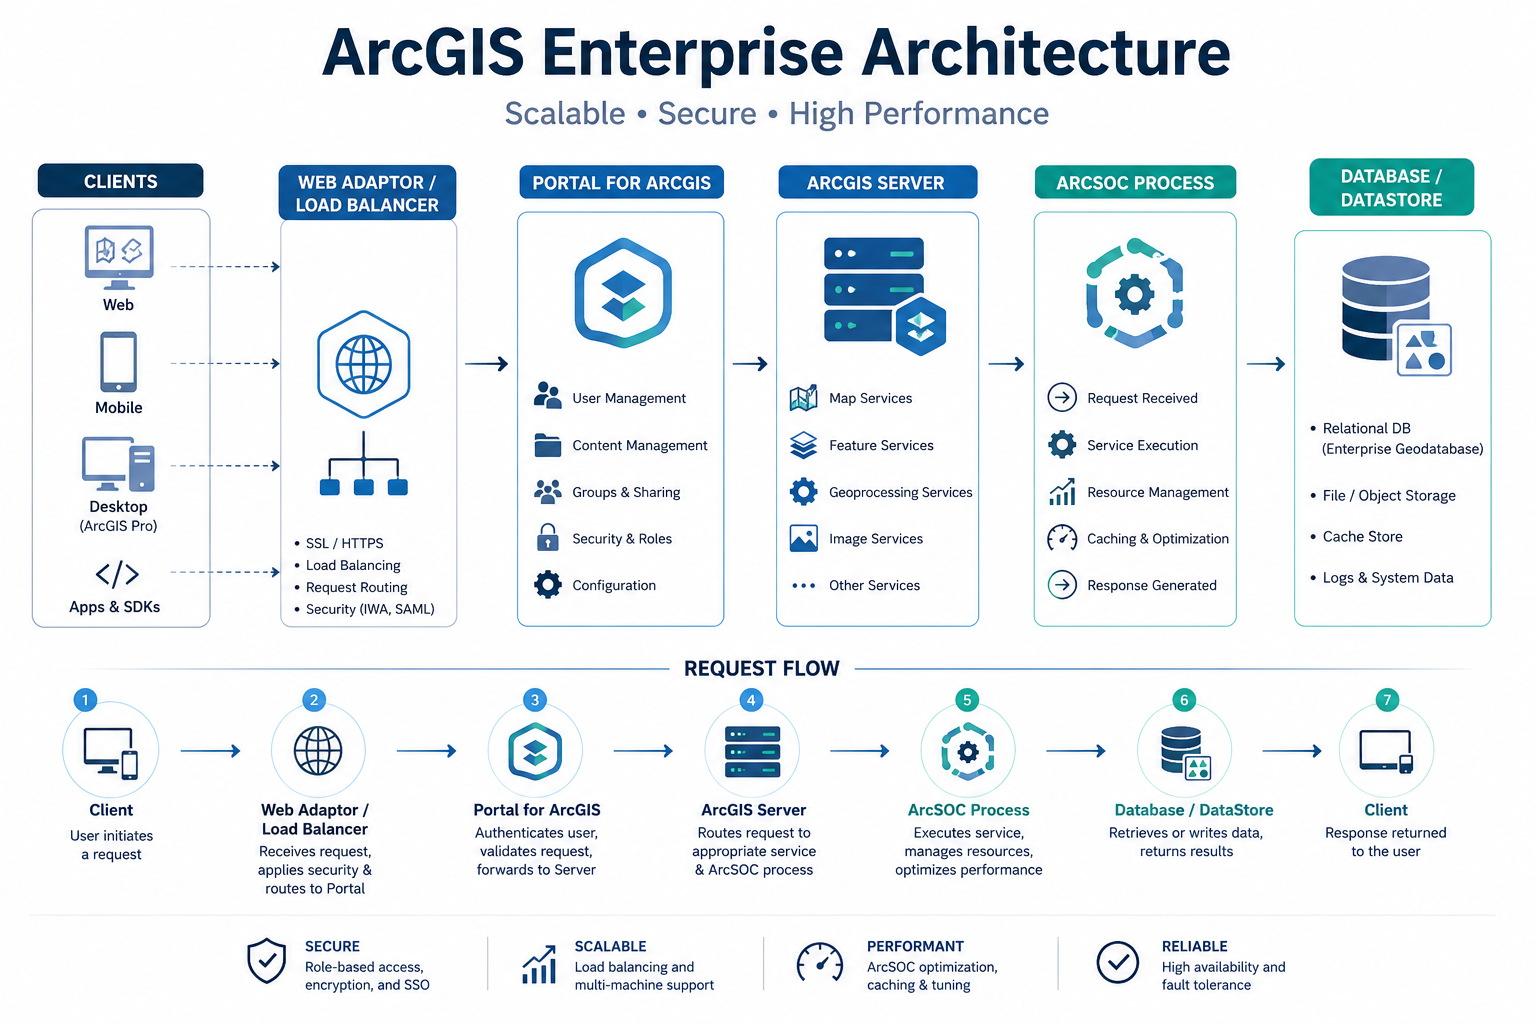
A typical request follows the path below:
Client → Web Adaptor / Load Balancer → Portal for ArcGIS → ArcGIS Server → ArcSOC Process → Database / DataStore
Each layer introduces potential latency.
| Component | Potential Performance Impact |
|---|---|
| Web Adaptor | Request routing delays |
| Portal for ArcGIS | Authentication bottlenecks |
| ArcGIS Server | Service execution delays |
| ArcSOC | CPU and memory consumption |
| Database | Query latency |
| Storage | Disk I/O bottlenecks |
One of the most common mistakes during troubleshooting is assuming the ArcGIS Server machine itself is the problem. In reality, ArcGIS Server is often waiting on a database query, network response, or storage subsystem. The goal is to identify where time is being spent rather than where users experience the delay.
Practical Example
Consider a feature service that takes 20 seconds to respond. Administrators often investigate the ArcGIS Server machine first. However, analysis may reveal:
- 2 seconds spent processing requests
- 17 seconds waiting for a database query
- 1 second returning results
In this case, ArcGIS Server is not the bottleneck at all, the database is. The key insight here: start by checking the data tier. Many “ArcGIS is slow” issues are actually datastore or database performance problems wearing a GIS mask.
3.0 ArcSOC Processes: The Heart of ArcGIS Server
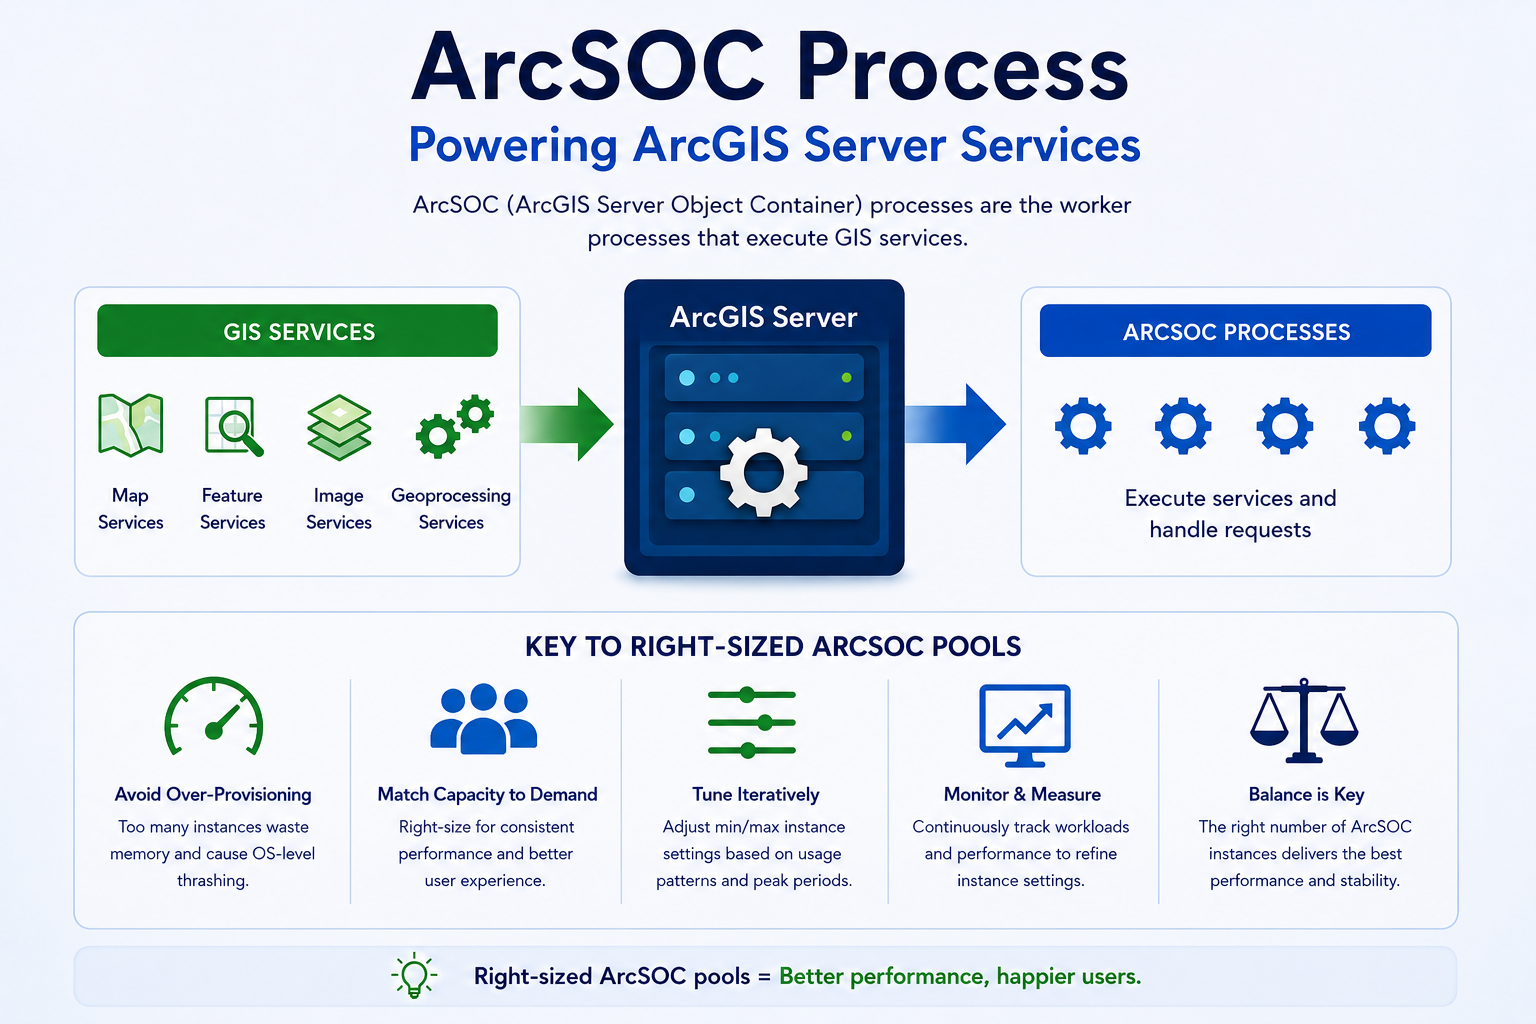
If ArcGIS Enterprise had a beating heart, it would be the ArcSOC process also known as ArcGIS Server Object Container. ArcSOC processes are the worker processes responsible for executing GIS services. Whether a user is viewing a map, querying features, running a geoprocessing task, or accessing an image service, the request is ultimately processed by an ArcSOC instance.
Each running service instance consumes resources such as Memory, CPU, File handles, and Network connections. This means ArcSOC configuration directly impacts performance.
3.1 Understanding Service Pooling
ArcGIS Server uses service pooling to efficiently manage resources. Two settings are particularly important:
- Minimum Instances defines the number of ArcSOC processes that remain preloaded.
- Benefits: Faster response times, reduced cold-start delays.
- Trade-offs: Higher baseline memory consumption.
- Maximum Instances defines the upper limit of concurrent service execution.
- Benefits: Supports more simultaneous users.
- Trade-offs: Increased CPU and memory utilization.
ArcGIS Server provides two primary interfaces to adjust pooling settings:
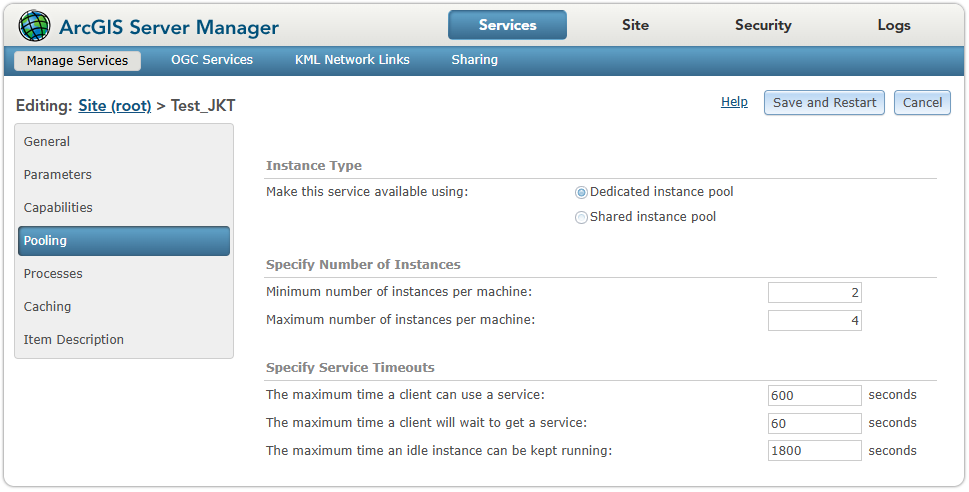
Option 1: ArcGIS Server Manager
The most straightforward method for everyday administrative tasks. Log in, navigate to the Services tab, locate your specific service, and under the Pooling section adjust the Minimum and Maximum number of instances.
In short: ArcGIS Server Manager → Services Tab → Select a service → Pooling.
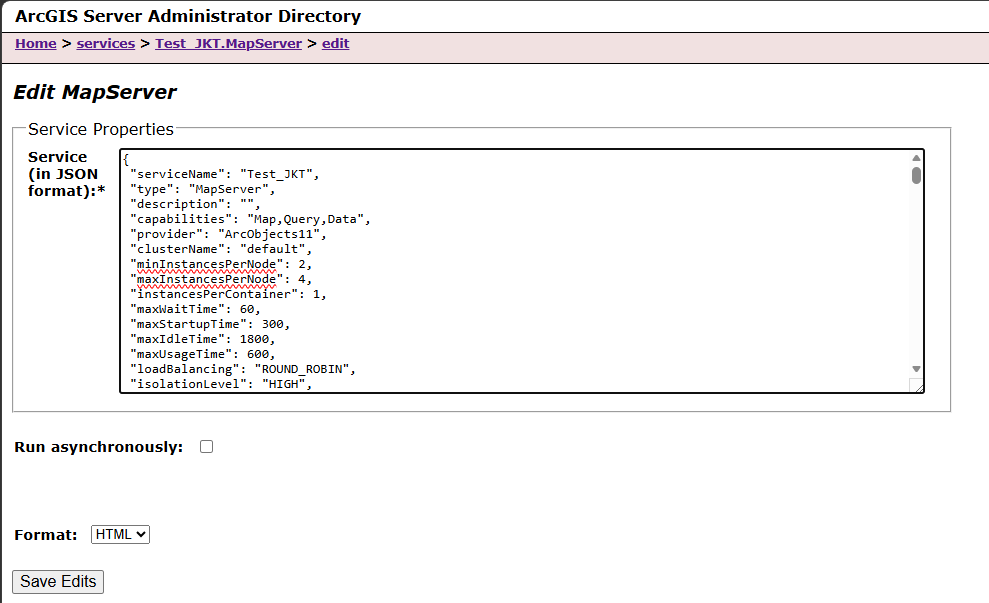
Option 2: ArcGIS Server Administrator Directory
For advanced users, scripting, or bulk changes, the ArcGIS Server Administrator Directory offers a RESTful interface. Navigate to https://<server>:6443/arcgis/admin, go to Services, select the service, and use the Edit option under Supported Operations to adjust minInstancesPerNode and maxInstancesPerNode.
In short: Administrator Directory → Services → Select a service → Supported Operations → Edit.
Pro Tip: Whenever you adjust pooling values, restart the service to apply the new settings. Make these changes during a maintenance window or off-peak hours to avoid service disruption.
A common misconception is that increasing maximum instances always improves performance. In reality, excessive ArcSOC instances often produce the opposite effect, creating resource contention that degrades the very performance you’re trying to improve.
On a server with 16 CPU cores and 32 GB RAM, launching hundreds of ArcSOC instances causes the kernel to devote disproportionate resources to context switching, scheduling, and memory paging. This management overhead outweighs parallelism gains.
3.2 Common ArcSOC Configuration Mistakes to Avoid
Over-provisioning: Each ArcSOC process consumes a measurable portion of your machine’s memory. When the number of instances exceeds available system resources, the system becomes unstable.
Identical settings for all services: Giving the same min/max to a high-traffic public map and a rarely used admin utility wastes resources. Shared instances are recommended for services that receive infrequent requests; dedicated instances are ideal for services that receive constant or compute-intensive requests.
Ignoring peak usage: Not adjusting for seasonal or event-driven spikes (e.g., disaster response, election maps). The optimal ratio of ArcSOCs to vCPU can only be determined through proper testing and observation.
Documentation references:
- Introducing shared instances in ArcGIS Server
- The Art and Science of ArcSOC Optimization
- The Number of ArcSOC Instances Causes ArcGIS Server Stability Issues
- Identify the Number of ArcSOC Processes in a Windows or Linux Environment
3.3 Practical Guidance on Pool Sizing
3.3.1 Budget by Machine
Decide how many concurrent ArcSOC processes your RAM and CPU can realistically support, then allocate that capacity across services. Size the ArcSOC-to-vCPU ratio so it supports user workflows without exceeding acceptable CPU and memory utilization.
3.3.2 Monitor Queue Length
If queue length stays above zero, requests are backing up and you likely need more instances or faster processing. Queue length is a leading indicator of capacity exhaustion. Two other parameters strongly affect queuing and timeout behavior:
- maxRecordCount: Limits how many records a service returns per query (commonly 1,000–2,000 by default). Keep it below 5,000 and tune based on real data size and network conditions.
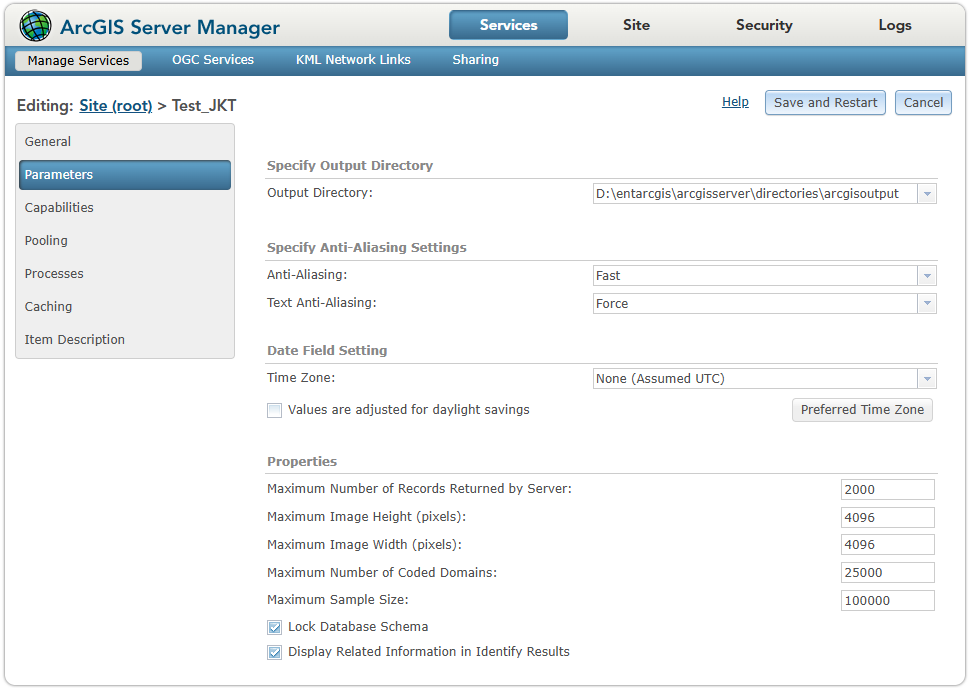
- Service timeout: Max service duration controls how long a client can hold an ArcSOC (default 600s). Max wait for a service controls how long a client will wait in the queue (default 60s).
If queue length is consistently above zero, lowering max-wait gives faster failure feedback but does not solve capacity issues. Tune maxRecordCount, timeouts, and pool size together.
3.3.3 Tune Iteratively
Change one service at a time, measure during representative peak load, then refine. Use the checklist below:
- Test one critical service at a time to isolate impact.
- Run changes during a known peak or a controlled load test.
- Start with conservative min/max, then raise only if metrics justify it.
- Keep min < max to free memory when idle; accept occasional spin-up delay.
- For business-critical services that must avoid spin-up latency, set min = max to guarantee capacity.
4.0 Memory Utilization and Heap Sizing
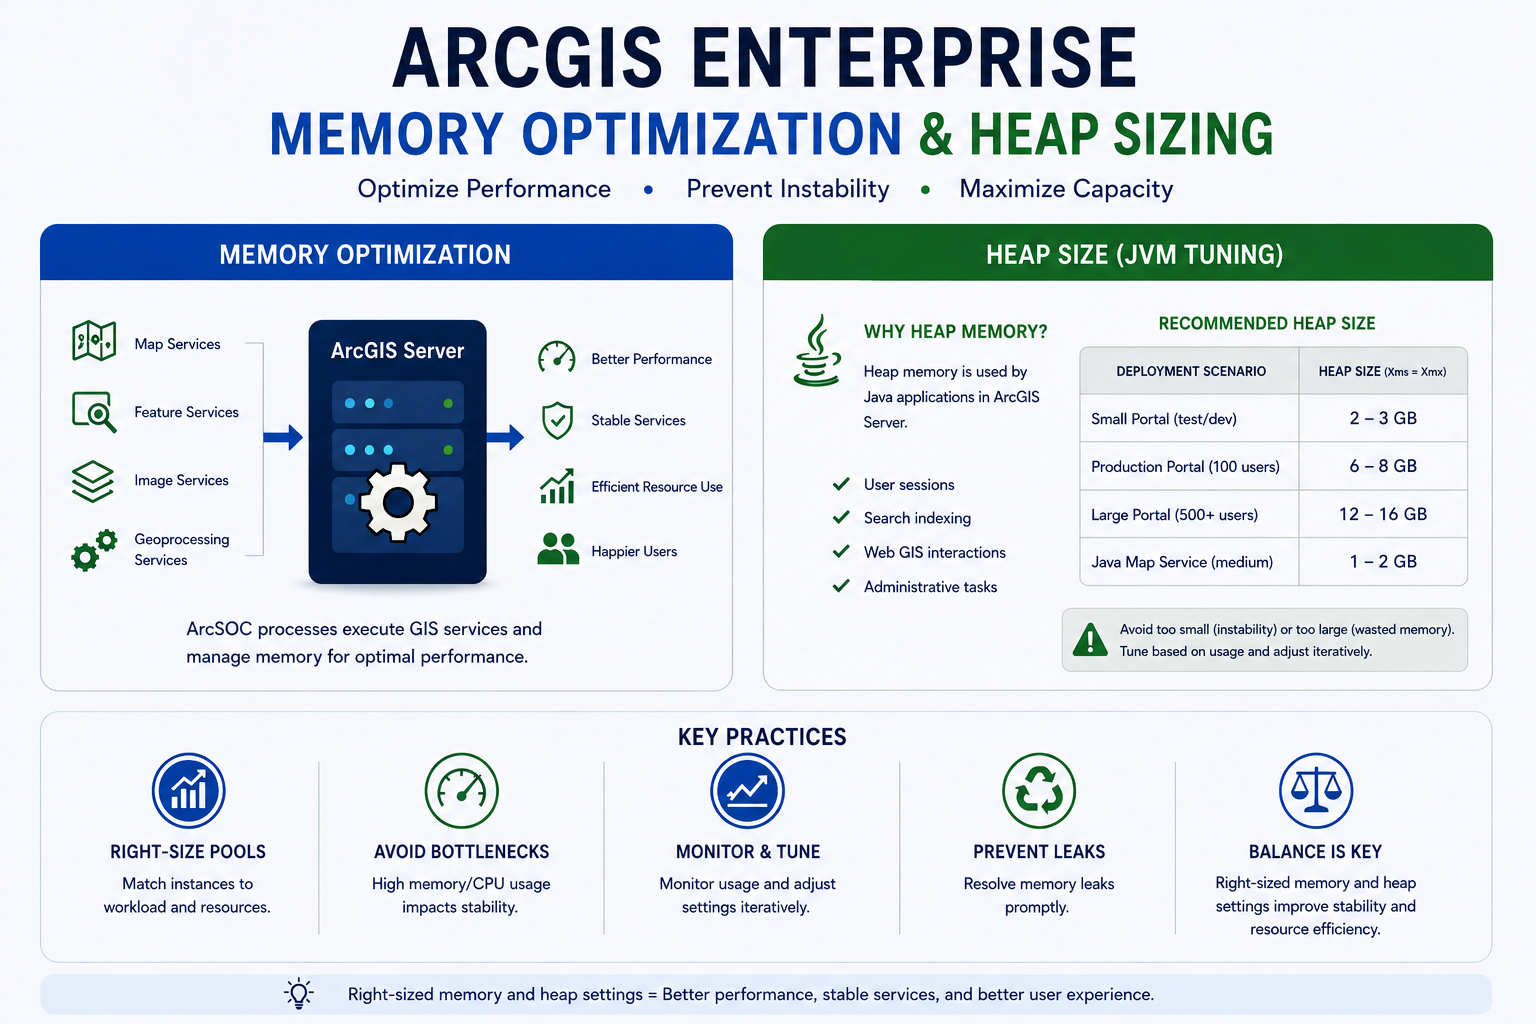
Memory issues are among the most common causes of ArcGIS instability. Many administrators focus exclusively on CPU utilization while overlooking memory consumption. ArcGIS Server performance is often constrained by available RAM long before CPU becomes saturated.
4.1 How ArcSOC Consumes Memory
Each ArcSOC process loads service definitions, map documents, data connections, runtime libraries, query results, and other required resources into memory. As service count increases, memory usage rises accordingly:
Number of Services × ArcSOC Instances × Average Memory per ArcSOC = Total Memory Consumption
Identifying Memory Pressure
Common signs of memory pressure include:
- Gradually increasing response times.
- Service crashes or unexpected ArcSOC recycling.
- Operating system swapping.
- High page file usage.
- Out-of-memory errors in logs.
Rule of thumb: If CPU usage is low but performance is poor, investigate memory pressure first.
Memory Bottleneck vs. CPU Bottleneck
| Symptom | Likely Cause |
|---|---|
| High CPU, low memory usage | Compute bottleneck |
| Low CPU, high memory usage | Memory pressure |
| High disk activity, low CPU | Paging or swapping |
| Intermittent crashes | Memory exhaustion |
Memory Leaks and Recycling
Memory leaks occur when custom code, or in some cases ArcGIS libraries, fails to release memory after handling a request. Over time, the ArcSOC process grows until it reaches system limits and crashes.
Detection: Monitor individual ArcSOC memory usage over time. If a process steadily grows and never returns to its baseline after requests complete, that is a strong indicator of a leak.
Mitigation:
- Review and fix custom code, including proper disposal of objects.
- Configure services to recycle after a defined number of requests or after a set time interval.
- Increase recycling frequency for services that show repeated growth patterns.
4.2 Heap Size and JVM Tuning
Components such as Portal for ArcGIS and several supporting services run on the Java Virtual Machine (JVM). JVM heap sizing is therefore an important tuning factor. Heap memory is used for user sessions, search indexing, authentication, web GIS interactions, and administrative workflows.
Symptoms of incorrect heap sizing:
- Undersized heap: Slow Portal pages, frequent garbage collection, authentication delays, unexpected Portal instability,
OutOfMemoryErrorin logs. - Oversized heap: Long garbage collection pauses (can freeze the UI), increased memory fragmentation, slower recovery after peak usage.
4.3 Practical Heap Sizing Guidelines
- Set
Xmsequal toXmxto avoid runtime heap resizing. - Start conservatively and leave room for the operating system and other processes.
- Monitor garbage collection frequency, pause times, and memory trends before making changes.
- Avoid blindly increasing heap size; tune based on evidence such as GC logs, utilization trends, or repeated memory errors.
| Scenario | Total RAM | Recommended Heap |
|---|---|---|
| Small Portal (test/dev) | 8 GB | 2-3 GB |
| Production Portal (100 users) | 16 GB | 6-8 GB |
| Large Portal (500+ users) | 32 GB | 12-16 GB |
| Java Map Service (medium) | 8 GB | 1-2 GB |
4.4 Heap Size Configuration on ArcGIS Server
Heap size is a critical ArcGIS Server advanced setting that controls the maximum file size that can be sent to or returned from the GIS server. This matters for operations that produce large results. For example, if a query returns more than 64 MB, the SOC maximum heap size must be increased or the operation will fail.
By default the SOC maximum heap size is 64 MB. You can tune heap size at two levels: server-wide (affects all services on that machine) or service-level (affects only a specific service). Esri recommends tuning at the service level where possible, as it generally delivers better performance.
4.4.1 Server-Level Configuration (via Administrator Directory)
This method sets a unified SOC maximum heap size limit for all services on the entire ArcGIS Server machine.
ArcGIS Server Administrator Directory → Machines → Select the target Server → Supported Operations → Edit → Adjust the SOC Maximum Heap Size (in MB).
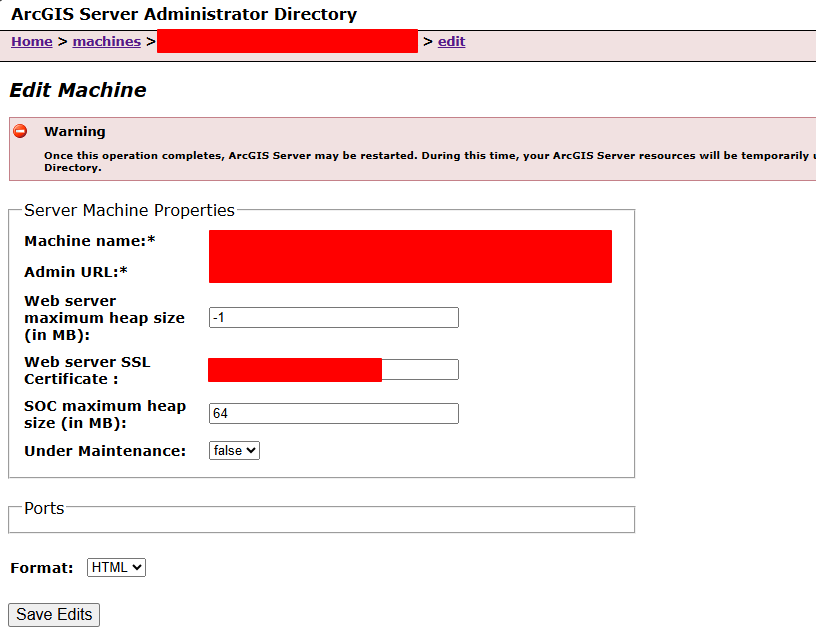
Note: If your ArcGIS Server site has multiple clustered machines, you must repeat these steps on all participating GIS servers.
4.4.2 Service-Level Configuration (via ArcGIS Server Manager)
A more intuitive graphical method for configuring heap size for a single service.
ArcGIS Server Manager → Services tab → Select the target Service → Processes → Adjust parameters accordingly.
4.5 The Danger of Blind Heap Tuning
One of the most common mistakes is increasing heap size simply because memory is available. Heap tuning should always be driven by evidence such as GC logs, memory utilization trends, or repeated OutOfMemoryError entries. Otherwise, tuning becomes guesswork.
5.0 Key Performance Metrics to Monitor
You can’t fix what you can’t measure. The following metrics provide the clearest view of service health, capacity, and user experience.
5.1 Core Metrics
- Response time: Track average, 95th percentile, and maximum values to understand both typical and worst-case performance.
- Throughput: Measure how many requests are handled per second to gauge overall service capacity.
- Error rate: Monitor the percentage of requests that fail to identify instability or overload early.
5.2 ArcSOC-Specific Metrics
- Busy instances: If busy instances consistently equal the maximum, incoming requests will begin to queue.
- Queue length: A queue length above zero for extended periods usually indicates insufficient capacity.
- Average ArcSOC lifetime: Very short lifetimes may point to crashes, recycling issues, or memory leaks.
- Memory usage per ArcSOC: Track trends over time rather than isolated values.
- CPU usage per ArcSOC: Identify services that consume disproportionate compute resources.
5.3 OS-Level Metrics
- Memory: Monitor used, available, and swap utilization.
- CPU: Review both total and per-core usage.
- Disk I/O: Watch read/write activity and wait time, especially during paging or heavy querying.
- Network: Track bandwidth, latency, and packet loss where relevant.
5.4 Data Tier Metrics
- Database CPU, memory, and disk I/O.
- Query execution time.
- Lock contention.
- Connection pool usage.
6.0 Tools and Techniques for Monitoring
6.1 Built-in ArcGIS Tools
- ArcGIS Server Manager: Useful for checking service status, number of instances, basic statistics, and logs.
- Server Statistics REST API: Useful for programmatic access to service statistics.
- ArcGIS logs: Set logging to VERBOSE or DEBUG during troubleshooting, but revert to Warning level afterward to avoid overhead.
- Portal Admin and browser developer tools: Useful for reviewing system health and troubleshooting Portal-related issues.
6.2 OS-Level Monitoring
- Windows: Performance Monitor, Task Manager, and Process Explorer (Sysinternals).
- Linux:
btop,htop,vmstat,iostat,netstat.btopis a personal favorite for its clear real-time view of CPU, memory, and disk usage. - Database tools: AWR (Oracle), Activity Monitor (SQL Server),
pg_stat_statements(PostgreSQL).
6.3 ArcGIS Monitor
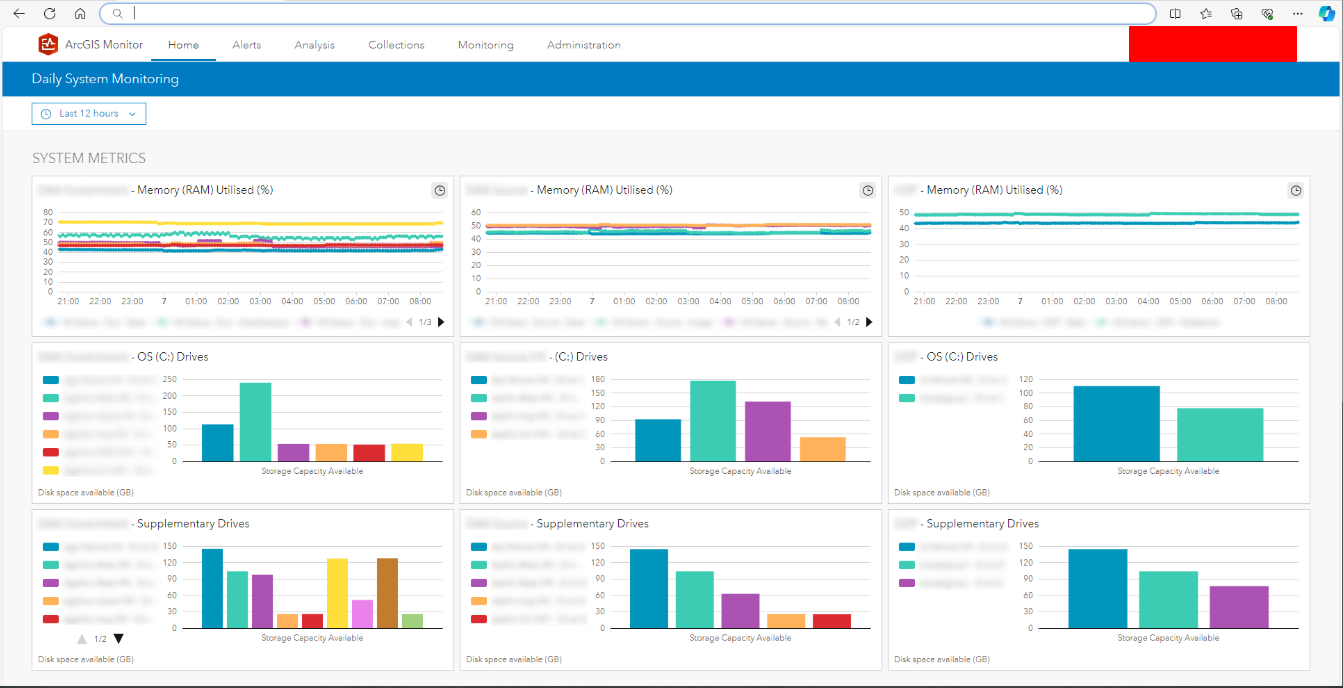
ArcGIS Monitor deserves special attention because it gives you a centralized view of the ArcGIS Enterprise stack rather than forcing you to correlate everything manually. It can collect metrics from servers, datastores, Portal machines, services, the operating system, and the database layer making it much easier to identify where bottlenecks actually originate.
Note: ArcGIS Monitor is an ArcGIS Enterprise extension that must be installed and configured separately.
ArcGIS Monitor is most useful to:
- Correlate service slowdowns with CPU, memory, disk, or database pressure.
- Track trends over time instead of relying on one-off snapshots.
- Set thresholds and alerts for recurring issues.
- Compare behavior across environments such as test, staging, and production.
- Support capacity planning by showing when resource usage is steadily approaching limits.
In practice, ArcGIS Monitor is most valuable when paired with service logs and OS/database monitoring, since it helps answer the question: is the slowdown caused by the service, the machine, or the data tier?
6.4 ArcGIS Performance Investigation Workflow
When performance issues are reported, follow a structured investigation process:
- Define the scope: Determine whether the issue affects all users, a single service, a specific application, or a particular region.
- Measure before changing anything: Collect baseline data such as CPU, memory, ArcSOC count, queue length, response times, and relevant log entries.
- Identify the bottleneck: Confirm whether the slowdown originates in Portal, ArcGIS Server, the database, the network, or storage.
- Make one change at a time: Avoid adjusting heap size, service pooling, and database settings simultaneously, or it will be impossible to determine which change helped.
- Measure again: Compare the results against the baseline to verify whether performance improved.
7.0 Common Performance Scenarios and Fixes
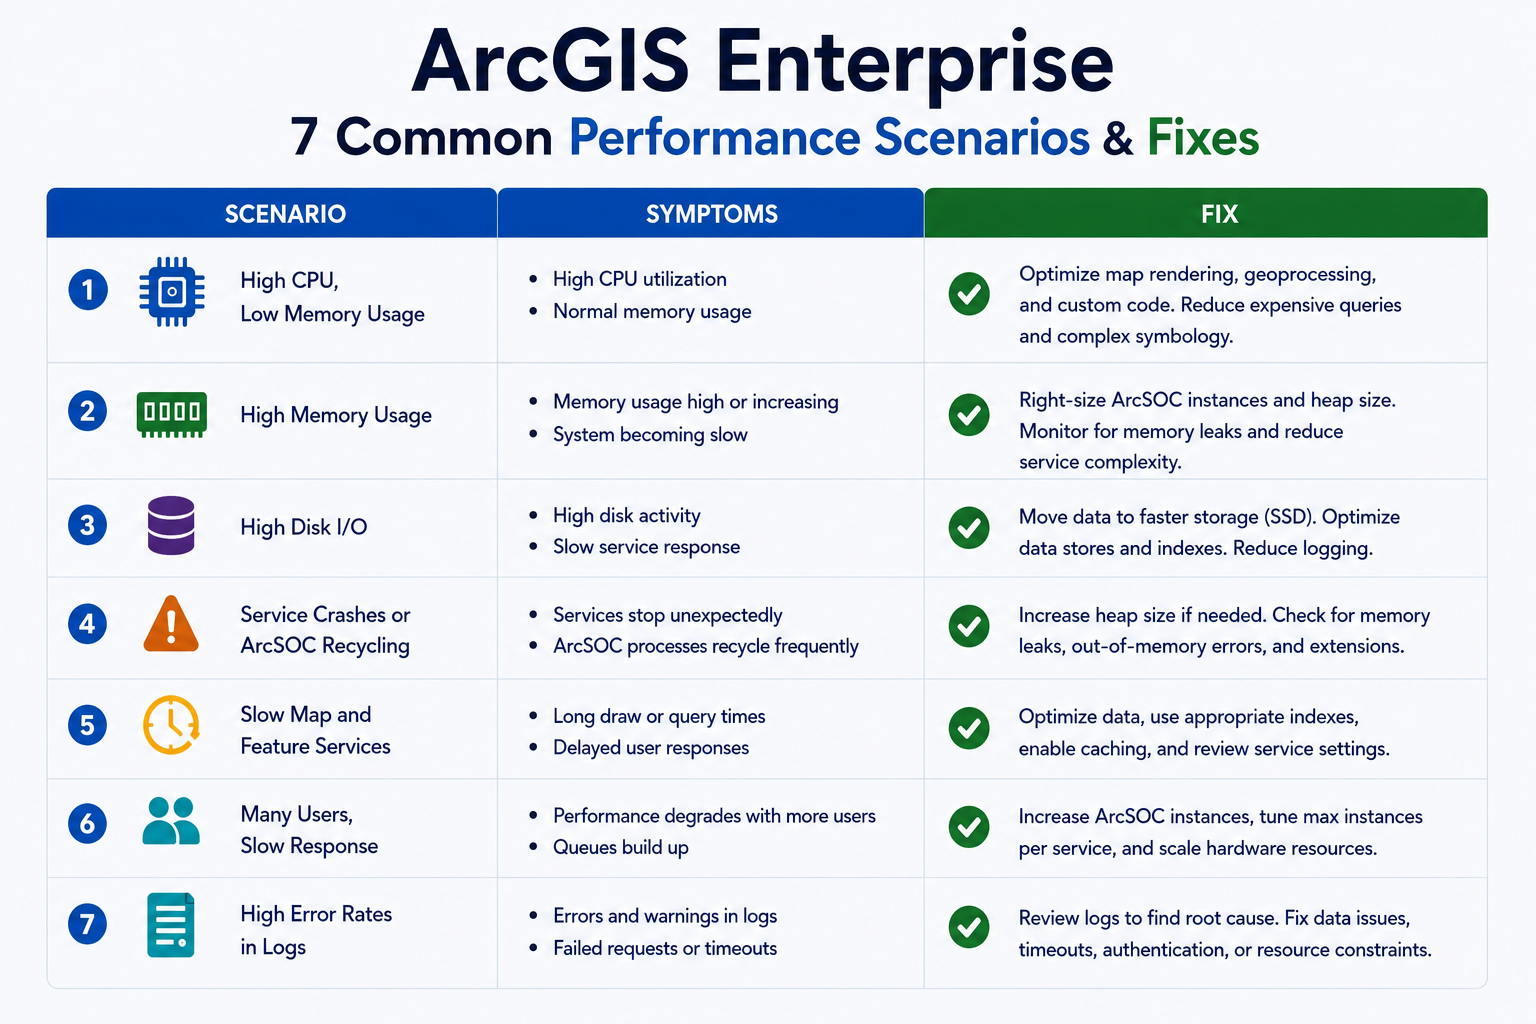
7.1 Scenario 1: Slow Map Services During Peak Hours
Typical Causes
- Insufficient ArcSOC instances
- Database contention
- Uncached map services
Potential Solutions
- Review service pooling (increase max instances if RAM allows).
- Enable tile caching for base layers.
- Optimize database indexes and query performance.
7.2 Scenario 2: ArcSOC Processes Consuming Excessive Memory
Typical Causes
- Memory leaks in custom code
- Excessive service counts or oversized pools
Potential Solutions
- Set service recycling (e.g., recycle after N requests).
- Redesign pools to match actual usage.
- Review ArcGIS version for known memory issues.
7.3 Scenario 3: Portal Feels Slow but Services Are Fast
Typical Causes
- Heap limitations
- Search index issues
- Authentication bottlenecks (external IdP latency)
Potential Solutions
- Review Portal logs for GC or OOM errors.
- Validate heap configuration and increase if needed.
- Investigate identity provider response times.
7.4 Scenario 4: Geoprocessing Service Timeouts
Typical Causes
- Request timeout too short for processing time
- Pooled service with long-running tasks
Potential Solutions
- Increase timeout values (Web Adaptor
ProxyTimeout, ServerRequestTimeout). - Change service to non-pooled (Min=0, Max=0) so each request gets a fresh ArcSOC.
- Add progress reporting to keep clients informed.
8.0 Best Practices and Runbook
8.1 Configuration Best Practices
- Keep minimum instances low unless real usage justifies higher values.
- Scale based on data, not assumptions, measure before and after each change.
- Avoid assigning identical pool sizes to every service.
- Review service utilization regularly and retire unused services.
- Cache content whenever possible, including tile caches and result caches.
- Optimize data sources before adding more hardware.
- Treat performance tuning as an ongoing process of measurement, analysis, and refinement.
8.2 Operational Runbook
Daily Checks
- Confirm all services are healthy in Server Manager.
- Review the last 24 hours of error logs.
- Investigate sustained memory usage above 70%.
- Investigate sustained CPU usage above 80%.
- Check disk usage and clean up if it exceeds 80%.
Weekly Checks
- Review response-time trends.
- Check queue length per service.
- Review GC logs for Java-based components.
- Verify backups are completing successfully.
Before and After Upgrades
| Before | After |
|---|---|
| Record a performance baseline. | Test all services if possible. |
| Back up all environments. | Compare performance metrics against the baseline. |
| Test in non-production first. | Review logs for new errors and monitor closely for several days. |
Quick Triage Checklist
- Is it one service? Check service status, type, and queue length.
- Is it one machine? Check OS resources and network health.
- Is it all machines? Check the database, data store, and network path.
- Were there recent changes? Review new services, updates, and data changes.
- Gather evidence: screenshots, logs, and performance data.
- Remediation actions: adjust pools, restart services, optimize queries if needed.
9.0 Additional Resources (ArcGIS Online, ArcGIS Pro, etc.)
While ArcGIS Enterprise is the focus of this guide, performance issues can originate outside ArcGIS Server including ArcGIS Pro on the client side, ArcGIS Online interactions, and the underlying database or storage layer.
Consider this the tip of the iceberg. A comprehensive performance assessment must cover the entire stack (clients, network, web tier, caching, data tier, and integrations) and follow a structured, measurement-driven process before implementing changes.
9.1 Performance Issues in ArcGIS Pro
ArcGIS Pro is a powerful but resource-intensive application. Its performance is influenced by hardware, system resources, data location, and application settings.
Diagnostic Monitor
ArcGIS Pro includes an integrated Diagnostic Monitor that provides real-time visibility into the application’s operations displaying status information, logs, and events continuously as you work. It is instrumental in diagnosing unresponsive conditions, resource overconsumption, function failures, and performance degradation.
To open the Diagnostic Monitor:
- Ribbon: Help tab → Performance group → Diagnostic Monitor.
- Keyboard shortcut:
Ctrl+Alt+M(a project does not need to be open).
The monitor includes several tabs: Counters, Tasks, HTTP, Log, and States. The Tasks tab is particularly useful — it highlights which operations are consuming the most time or resources.
Clear Cache
ArcGIS Pro uses a local feature cache to optimize performance, storing features in a temporary folder for quicker access. However, this cache can become outdated or bloated over time, leading to performance issues.
To configure cache clearing:
ArcGIS Pro → Project → Options → Display → Toggle Clear cache each time the application closes.
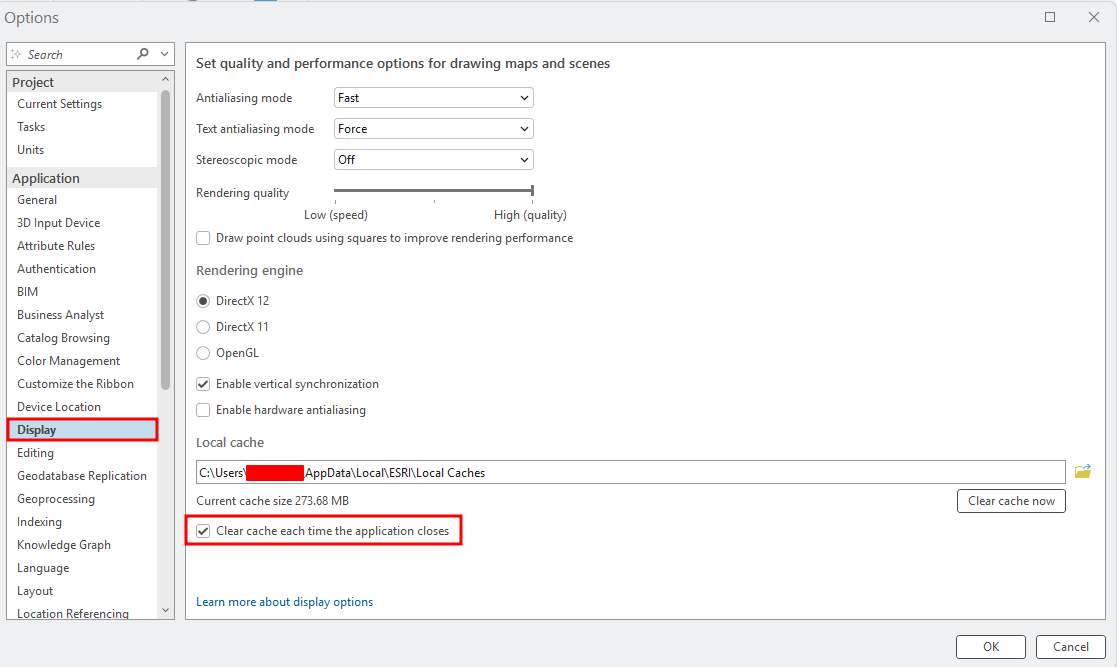
This helps avoid caching issues when working on multiple projects or when data is being updated by other users.
Additional Documentation
- Diagnostic Monitor | ArcGIS Pro documentation
- Performance in ArcGIS Pro | ArcGIS Pro documentation
- ArcGIS Pro Performance Assessment Tool | ArcGIS Pro documentation
9.2 Performance Issues in ArcGIS Online
ArcGIS Online is a cloud-based platform managed by Esri, but performance can still be impacted by data volume, query complexity, and the configuration of your data storage.
9.2.1 Feature Data Store
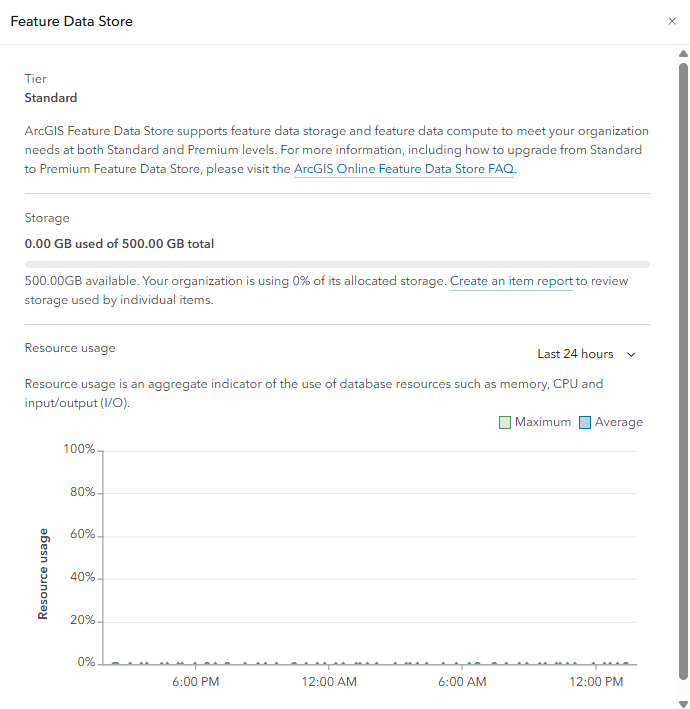
The Feature Data Store is the backbone of ArcGIS Online hosted feature layers. Esri offers two main tiers:
- Standard Feature Data Store: The default option for all ArcGIS Online subscriptions, suitable for common workflows with a baseline level of compute power measured in Request Units per Minute (ru/m).
- Premium Feature Data Store: An optional upgrade providing significantly more compute capacity for demanding queries, editing, analysis, and ETL tasks. Performance scales in tiers (M1 to M4), with each level providing twice the compute power of the previous one. The M4 tier offers 16× the compute available with the standard store.
Additional Documentation
9.3 ArcGIS Online Health Dashboard
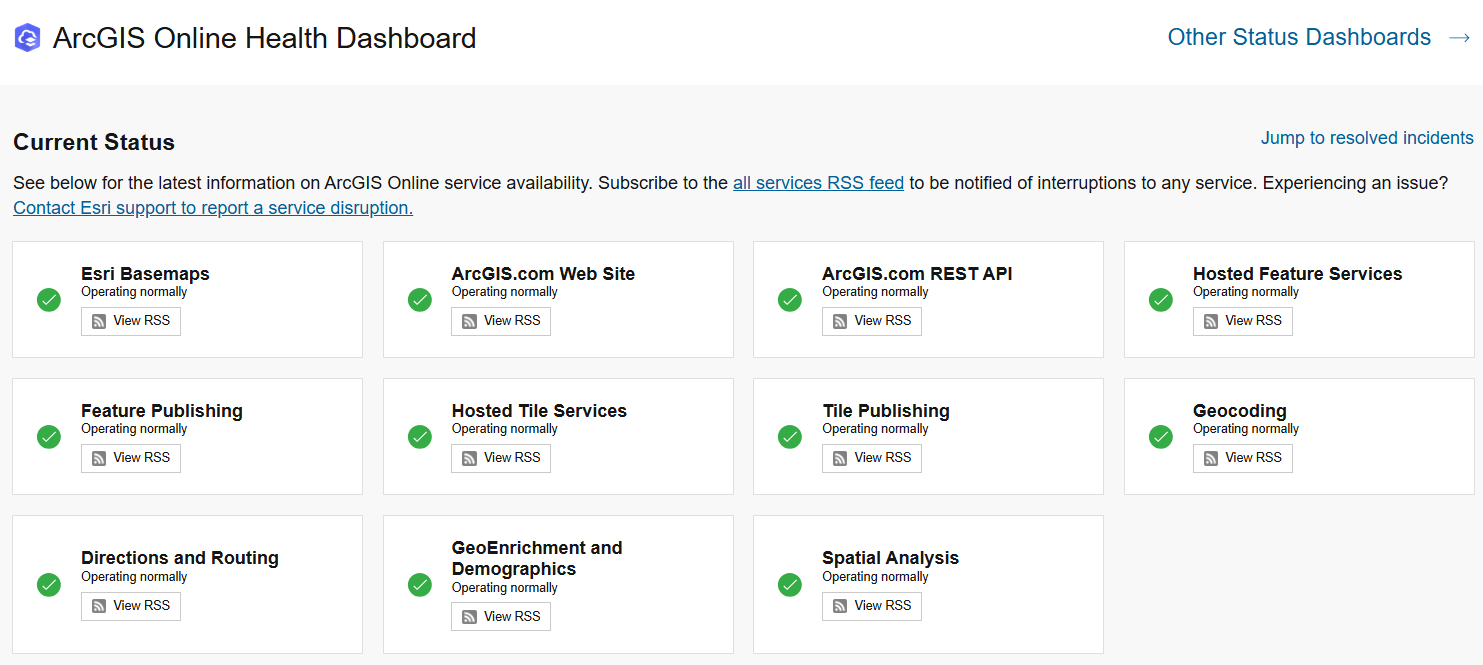
When experiencing performance issues with ArcGIS Online, the first step is to determine if the problem is widespread. The ArcGIS Online Health Dashboard provides status information on events verified to impact the majority of users.
This public resource shows the current operational status of various ArcGIS Online services. If a problem is reported on the Health Dashboard, it confirms the issue is on Esri’s side — monitor the dashboard for updates on a resolution.
Additional Documentation
10.0 Conclusion and Final Thoughts
ArcGIS Enterprise performance issues rarely have a single cause. Slow applications, timeouts, and unstable services typically result from interactions between ArcSOC processes, memory use, service pooling, database performance, and JVM settings.
Adopt a repeatable troubleshooting methodology rather than jumping straight to configuration changes. Effective administrators follow a structured methodology and avoid assumptions.
Key principles
- Performance is a system property: every layer, from web tier to database, matters.
- Measure before you change: establish baselines so you can quantify impact.
- Start with the data tier: databases are often the root cause.
- Right-size ArcSOC pooling: set appropriate min/max worker counts.
- Manage memory actively: monitor ArcSOC and JVM heap usage.
- Tune iteratively: make one change at a time and observe results.
- Automate monitoring: detect regressions before users report them.
When users report slowness, aim to discover why the environment or tool is behaving that way, rather than applying a quick random fix. With that diagnostic mindset, performance tuning becomes more predictable and far more effective.